Meet the Nevada climatologist who helps write the U.S. Drought Monitor


Good morning, and welcome to the Indy Environment newsletter.
As always, we want to hear from readers. Let us know what you’re seeing on the ground and how policies are affecting you. Email me with any tips or suggestions at daniel@thenvindy.com
To get this newsletter in your inbox, subscribe here.
Many of us are familiar with the U.S. Drought Monitor. It is frequently cited in news articles and reports. Government officials use it to make decisions about policies, and lawmakers point to it for a rough estimate of how severe drought conditions are. It has real-world consequences too, relied upon to determine where disaster relief ought to go and to support crop insurance claims.
It’s no surprise that it’s shared so widely. Many parts of the West are preparing for an even more arid future, the consequences of which are coming into greater focus as greater attention is paid to changes in precipitation and temperature. The drought monitor is also visual and clear. In this way, it is an immensely shareable piece of science communication, perfect for our online world.
Over the past few years, I have looked at the U.S. Drought Monitor more frequently, including historical drought data. And it prompted me to ask: What is this map telling me? What conclusions should I take away from it? The answers to those questions turned out to be closer to home than I expected, about an 11-minute drive from my house to the Desert Research Institute.
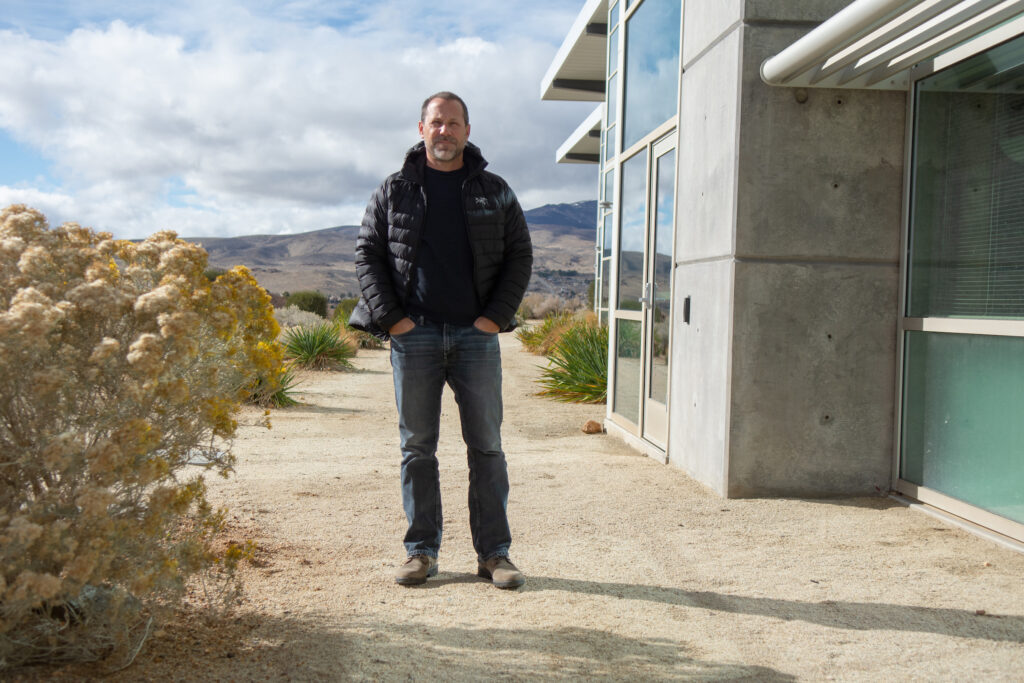
Since 2012, David Simeral, an associate research scientist at the institute, has played a role in helping draw the drought map each week. Simeral is one of nine national U.S. Drought Monitor authors, and he is the only one based in the West, where arid conditions are a defining feature throughout much of the region. Earlier this week, I met with Simeral in his office at the Desert Research Institute’s Reno campus to talk about how he creates the map and what data is used for it. Simeral is part of the Western Regional Climate Center, which is housed at the institute.
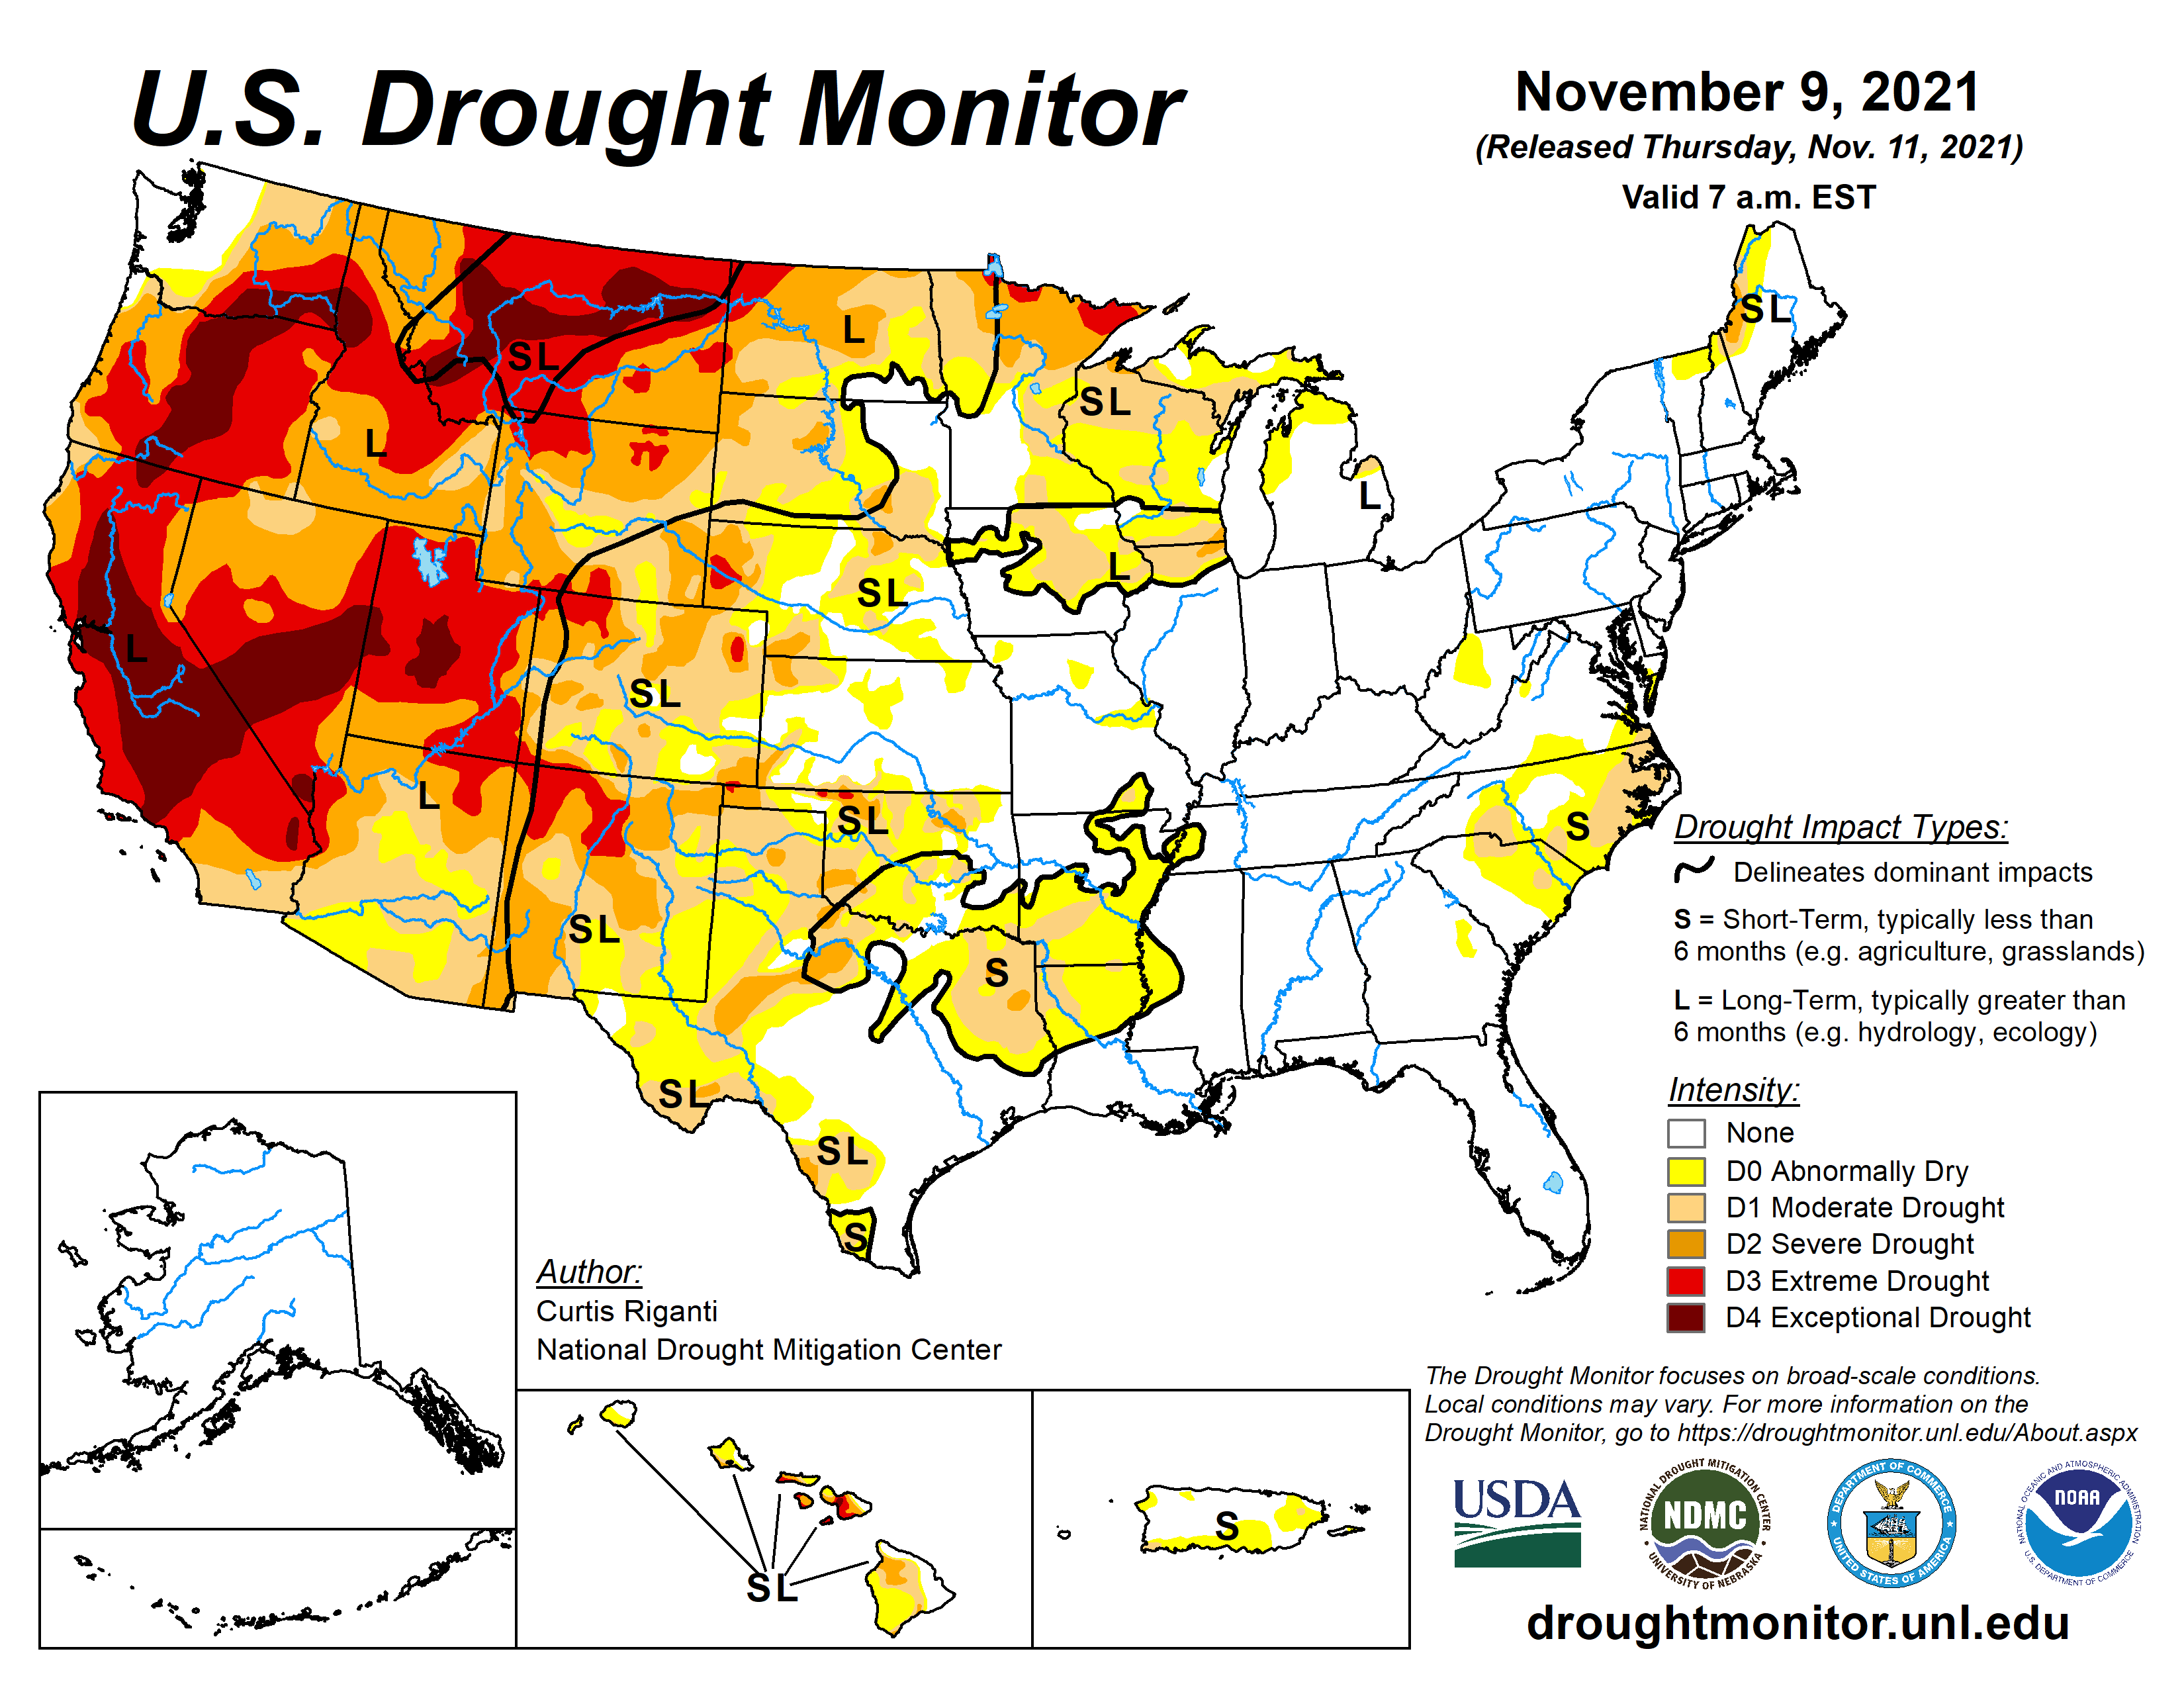
When I got to the office, Simeral opened a Drought Monitor map from September, the last time he was the lead author. That was the first thing I learned: There’s one lead author for each map, and the nine authors rotate to serve as the lead author for the entire U.S. map, which is updated once a week and released on Thursday (check out the latest version here).
The second thing that Simeral emphasized was that each drought map pulls from a lot of different data and sources. The map is hardly automated. On Simeral’s computer, he has a list of mapped data that he can toggle through: precipitation, soil moisture, streamflow measurements (to name only a few). Using this data, and comparing it to conditions plotted the week before — or several weeks and months before — Simeral is able to start to get a sense of how drought is developing in a particular area. There are dozens of indicators to go through, and many of them get hyperlocal, down to the level of a particular stretch of stream.
The finished map defines on-the-ground conditions using five main categories, ranging from D0 (abnormally dry) to D4 (exceptional drought). There is not a quantitative formula for determining these categories. Instead, authors including Simeral look at the indicators and data to determine each week how drought is progressing. For instance, if data point to improvements in an area that is experiencing exceptional drought, Simeral might downgrade the area to D3 (extreme drought).
Simeral calls this a “convergence of evidence approach.”
Why is the map created this way? Why not simply rely on precipitation? Drought, despite the word’s everyday use, is actually not easy to define. According to the National Integrated Drought Information System, “drought is generally defined as ‘a deficiency of precipitation over an extended period of time (usually a season or more), resulting in a water shortage.’”
There are, however, different types of drought, and they are not necessarily exclusive. These include meteorological drought, hydrological drought, agricultural drought and ecological drought. They are cumulative too, requiring a look at not only the most recent rainfall, but a variety of factors.
When Simeral writes the drought map and is listed as the lead author, he is hardly going about the challenging task alone. In fact, he describes the creation of the weekly drought map as an iterative process, where there are drafts, robust discussions and feedback from those on the ground. When Simeral is charged with writing the map, he says he is often the first one in the office and the last to leave. There are long days filled with dozens of phone calls, email replies and meetings.
As of October 2020, about 451 people — weather forecasters, state agency officials and academics — belonged to a listserv for creating the drought monitor. On any given week, a portion of them help participate in the map’s creation. Participants on the state and regional level offer local expert input, recommending certain regions that should have their drought status upgraded or downgraded. It’s the drought author’s job to then weigh those recommendations by looking at the data.
Simeral and other authors hear anecdotes directly from farmers and ranchers, as well. In some cases, a staffer from a congressional office might call. Sometimes there are insights about what they are seeing on-the-ground or from constituents. Other times, there are criticisms of a map that policymakers have since tied to important decisions, including disaster funding.
Simeral acknowledged that there can be differences of opinions, even within the group working on putting the map together. He said he takes the concerns seriously, and has gained a lot of insight from talking through the map with agricultural producers. But impacts that might look drought-related can be tied to other factors, including how land and water are managed.
“I take [them] seriously, but there is a level of verification that has to occur,” Simeral said.
After all, the map is not only a map. Each week, the map comes with a narrative. That’s often missing when the map is shared online or in articles. But Simeral said it’s a critical part of the end product, and the narrative goes into more detail about what is happening in each region of the U.S. It talks about policies, agency decisions and other factors that can influence drought impacts. The narrative is important, too, because the character of drought can be different in different places.
“Drought comes in different forms,” Simeral said. “It manifests itself differently in every location.”
He pointed to the Southeast, which sees “flash droughts.” If no rain comes, even for just a few weeks, sandy soils in the region can dry out rapidly and bring immediate impacts, Simeral said. In the Southwest, where the climate already trends arid, Simeral might look at other indicators, watching how conditions unfold over a longer period of time. This is not always an easy task, especially in a state like Nevada, where hydrological and ecological impacts occur in remote areas that are not always well documented. Certain parts of the state also lack strong data.
Then there is the question of how to view the map in a world where “normal” is not what it used to be. The climate is changing, and parts of the West are at the frontlines. The term “megadrought” is often tossed around these days. And respected scientists in the Colorado River Basin have even suggested using the term “aridification” as the term “drought” connotes a temporary condition.
The drought map is a tool, and it is a reflection of what’s going on week-by-week. But it is also useful in seeing how things have changed over time. Its inputs are climate data, and the U.S. Drought Monitor website offers a historical time series showing how droughts have developed.
Looking at the data each week has given Simeral a firsthand look at how things are changing in the West, where drought is becoming more frequent and severe. The last two years, he said, have been notable because of the way extreme heat has affected other systems, including the accumulation of snowpack, a critical water source.
During the interview, Simeral opened up the historical time series on the computer. What he said he has found “alarming” is how quickly this current drought ramped up in its intensity.
“The water implications are huge,” he said. “And water is everything in the West.”
Here’s what else I’m watching this week:
“Best example globally of how things can go badly:” The Los Angeles Times’ Ian James wrote about COP26 and the Colorado River. Water experts at the conference see the Colorado River as a case study for the many ways in which climate change, on a global scale, is adding stress to the way we manage important water supplies — and how we should prepare for it.
- A stretch of river that is coming back to life: Excellent and visually-moving reporting from The Salt Lake Tribune’s Zac Podmore and photojournalist Francisco Kjolseth on the rapids, canyons and ecosystems coming back to life as Lake Powell recedes.
- “If you know one tribe, you know one tribe:” E&E News’ Jeremy Jacobs reports on efforts to ensure Indigenous communities have a seat at the table during negotiations on how to manage a Colorado River Basin faced with ongoing drought and growing risks from climate change. In the past, tribes were shut out of critical negotiations about how to manage the river. “You have a group of at least 30 tribal sovereigns in the Colorado River basin who have lived [sustainably] there for thousands of years," Daryl Vigil, water administrator for the Jicarilla Apache Nation, said at a recent conference. "We are having these conversations about sustainability and resiliency, why aren’t we talking to those people who are still here who have been resilient and have lived sustainably?"
- Halting controlled floods in the Grand Canyon: The Arizona Republic’s Brandon Loomis writes about low water levels in Lake Powell and a federal agency’s decision this year to halt an environmental program meant to restore sandbars in the Grand Canyon.
A new water strategy: The state is updating its State Water Plan, which was published in 1999. On Tuesday, the Division of Water Resources released a survey to gather input from the public. In a press release about the survey, Nevada State Engineer Adam Sullivan said: “As the driest and one of the fastest-growing states in the nation, the demands on our limited water resources make thoughtful and strategic water management in Nevada more important than ever.”
- Climate position moves to governor’s office: Gov. Steve Sisolak announced a new position in his administration this week: Senior Climate Advisor Kristen Averyt, who was acting as the state’s climate policy coordinator in the Department of Conservation and Natural Resources, will serve in the position. Averyt, the former president of the Desert Research Institute and an expert in western water issues, shared in the 2007 Nobel Peace Prize for her scientific work with the Intergovernmental Panel on Climate Change.
Southwest Gas responds: Southwest Gas’ board rejected activist investor Carl Icahn’s tender offer, Reuters reported on Tuesday. Here’s the press release from Southwest Gas Holdings.
Replacing two earthen dams in Reno: The Reno Gazette Journal’s Amy Alonzo writes about why two earthen dams in Reno, classified as “high hazard,” could be up for a replacement.
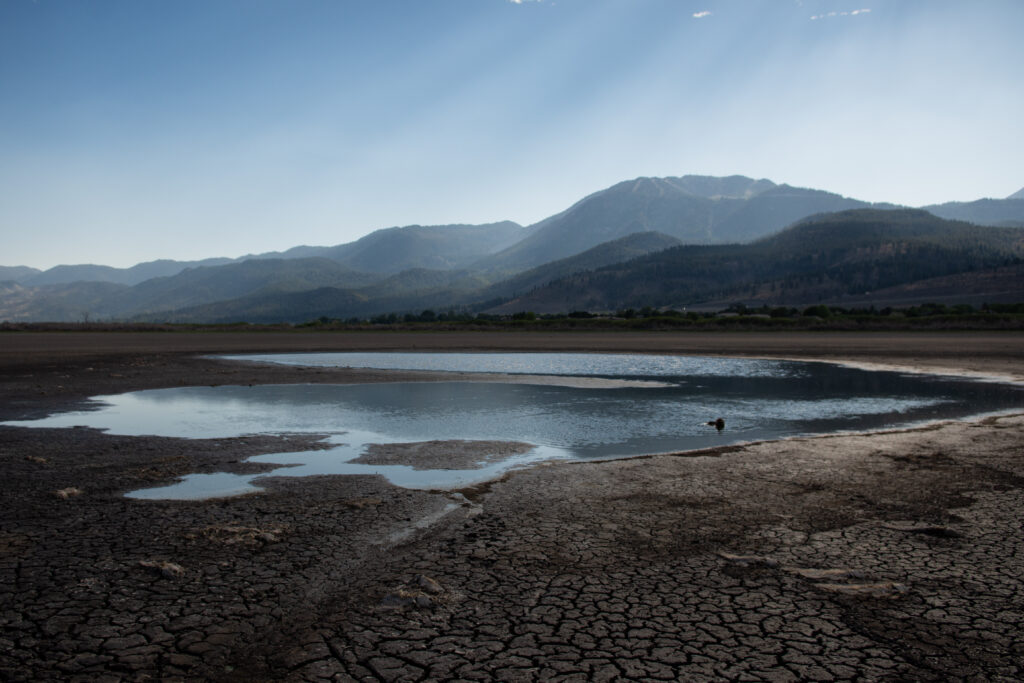
Restoring Little Washoe Lake: Over the summer, Nevada Independent photographer David Calvert took sobering photos documenting the exposed lakebed and drying landscape around Little Washoe Lake outside of Reno. Even during an intense drought, the sudden dry conditions at Little Washoe Lake were shocking. The Nevada Department of Wildlife started to investigate the situation. A spokesperson for the agency attributed the lake’s decline to extremes, flooding that washed out a diversion feeding water into the lake, followed by drought. Earlier this week, the agency announced that they funded and helped fix the diversion with the Washoe Lake Reservoir and Galena Creek Ditch Company. The Reno Gazette Journal has more.
Wildlife commission denies ban on coyote killing contests: A state wildlife board voted against a prohibition on coyote hunting contests last week. The Reno Gazette Journal’s Amy Alonzo wrote more about the decision. Before the board vote, Nevada Department of Wildlife Director Tony Wasley said “hunting should not be a competition. If it’s not good for the image, it’s not good for the future.” Seven states have enacted some form of ban, the RGJ reported.
What happens after a fire: The Reno Gazette Journal’s Amy Alonzo and photographer Jason Bean look at the effects of the Caldor Fire, which threatened South Lake Tahoe earlier this year.
- The San Francisco Chronicle’s Gregory Thomas looks at what the Caldor Fire has meant for the Sierra-at-Tahoe ski resort, hit hard by the blaze, and recovery efforts.
The fight over Thacker Pass: InsideClimateNews’ Cayte Bosler published an in-depth piece looking at the opposition to the proposed Thacker Pass lithium mine in Humboldt County. On Monday, a federal judge said she would not reconsider a previous ruling and halt work on the mine in light of new evidence of a massacre near the site, Bloomberg Law’s Maya Earls reports.
Lithium-ion battery prices: Benchmark Mineral Intelligence reported last month that lithium-ion battery prices have increased as material prices increased during 2021. “Lithium carbonate has been singled out as a major driver behind the battery cell price increases,” the company wrote.
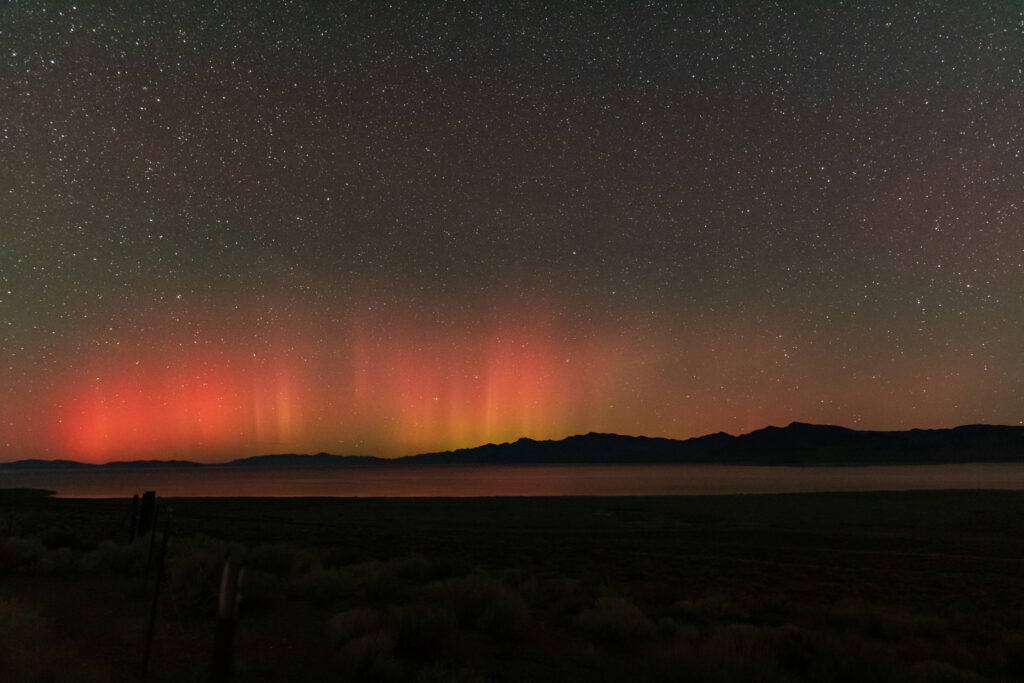
Aurora in Nevada: Reno-based photojournalist Trevor Bexon captured an incredible image of a rare aurora sighting earlier this month. He shares the story behind the image with This is Reno.